 As a company now entering its teenage years, Boxx Communications has bared witness to many of the biggest and best changes in the telecommunications industry.
The notable movements include faster and more reliable broadband, the rapid growth of IP voice solutions and, of course, a steep fall in pricing.
To put into perspective the scale of these changes we have some statistics accumulated over 6 years, between 2011 and 2016.
In this period, the number of Fixed (Phone) Lines has remained steady; rising from 33.3 million to 33.7 million between 2011 and 2015 before falling back slightly to 33.5 million in 2016. This stability derives from the infrastructure that we adopt here in the UK: in order to have a broadband connection, a fixed telephone line is required.
The changes in numbers appear when looking at the activity on these lines;
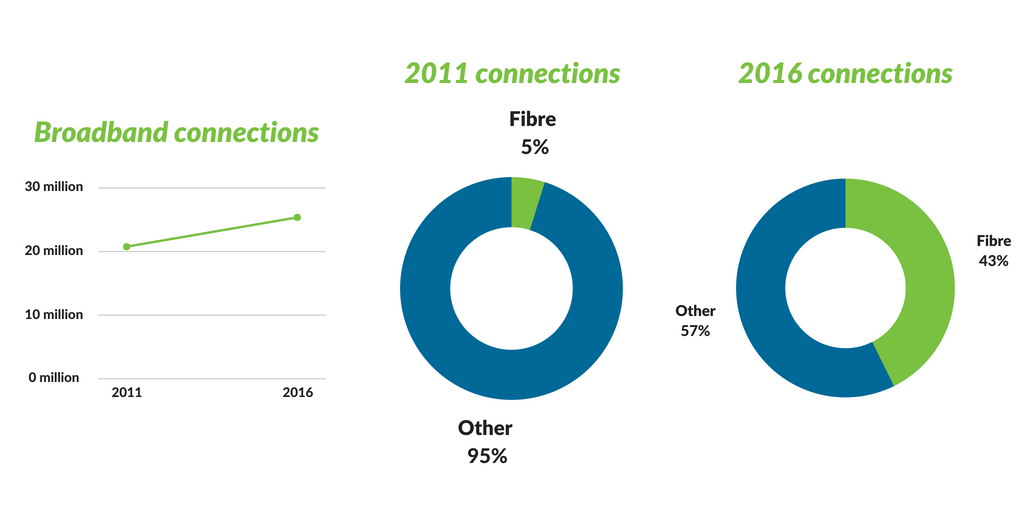
The number of broadband connections increased by 22.2%; starting at 20.7 million connections in 2011 and rising to 25.3 million by 2016. The increases year upon year were very steady with jumps of 1 million give or take a couple of thousand.
What’s more staggering is 1 million of those 20.7 million connections in 2011 were fibre, yet by 2016 that figure has grown to an impressive 10.8 million! A growth of almost 2 million fibre connections per year and a total percentage growth of 980% in total. This really highlights the increasing availability of fibre services around the UK as well as the growing need for those ever-cheaper connections.
In similar fashion – mobile and landline minutes saw massive movements…
While the number of landline minutes accumulated each year fell by 46 billion (41.4%) to 65 billion, the number of mobile minutes increased by 20 billion (15.3%) to 151 billion.
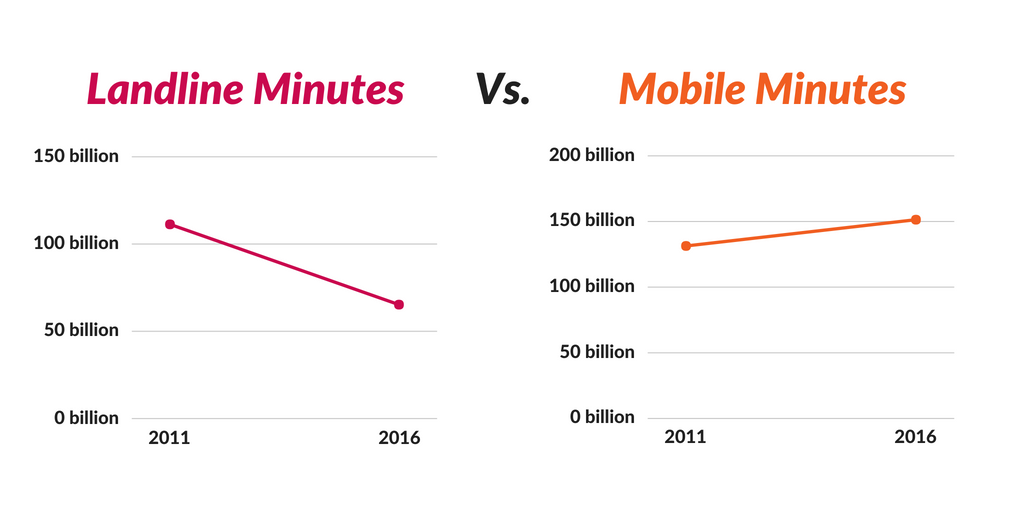
These statistics highlight the movement away from the traditional landline as we move towards mobiles and IP solutions as our go to platforms for making calls.
As applications, such as iMessage and Whatsapp, come to the forefront, traditional MMS and SMS see less of the limelight. In 2016, 54 billion fewer texts were sent compared to 2011. Having said that, 96 billion were still sent.
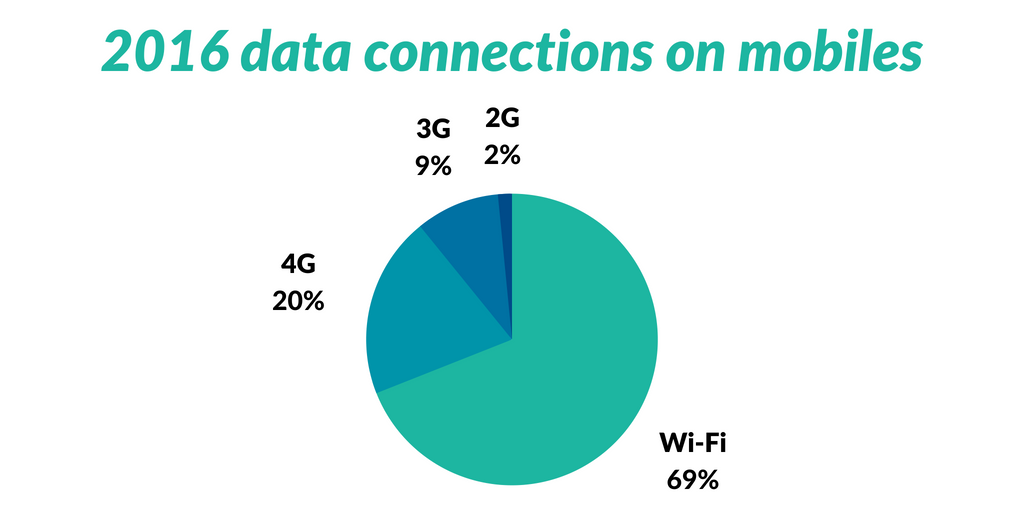
In recent years, 4G has been the biggest technology to hit the mainstream. Despite this, 2016 figures show that 69% of data connections on mobiles took place over Wi-Fi. The remaining 31% of mobile data is broken down into 65% 4G, 30% 3G and 5% 2G.
In retrospect, the number of ADSL broadband connections fell to 13.6 million – a decrease of 6.2% compared to 2015.
The movement to higher capacity internet connections has seen the volume of data consumed by user’s skyrocket. Larger files have become easier to download meaning more and more are downloaded.
In 2016 alone, there was a 36% rise in the average users download numbers, a number that is expected to continue rising at a similar, if not faster, rate.
Now that we’ve covered how the UK looks, how do we compare to our fellow nations?
• We ranked 4th behind the US, China and Japan when it came to the revenue generated by voice and data services.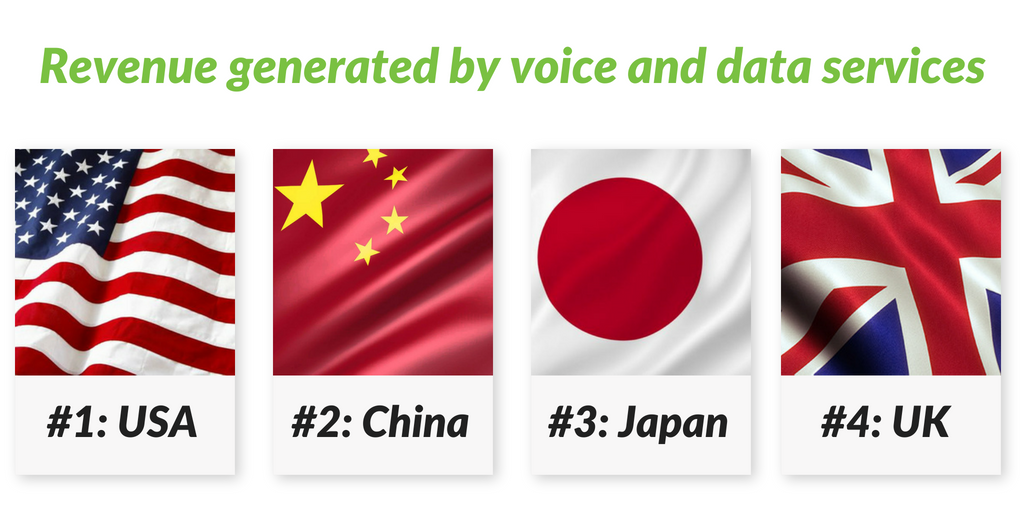
• Surveys shows that 98% of the UK has access to speeds of at least 10Mbps which puts us back in our favourite position: 4th.
• 92% of us can receive speeds of 30Mbps or greater but unfortunately, there’s a large drop-off in number that can receive full fibre services at just 2%, placing us 18th out of 20 on the list.
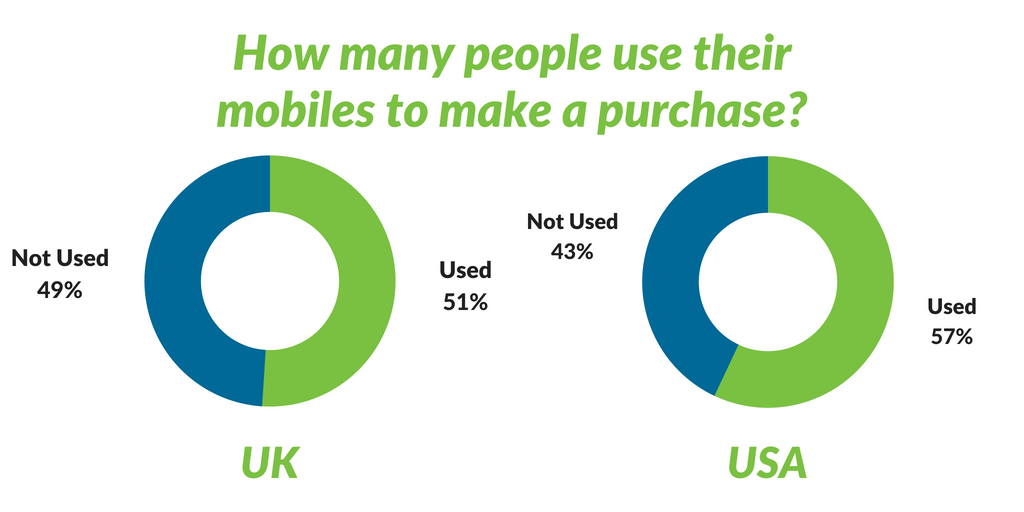
• 51% of us have used our mobiles to purchase a product online. In the U.S, 57% have.
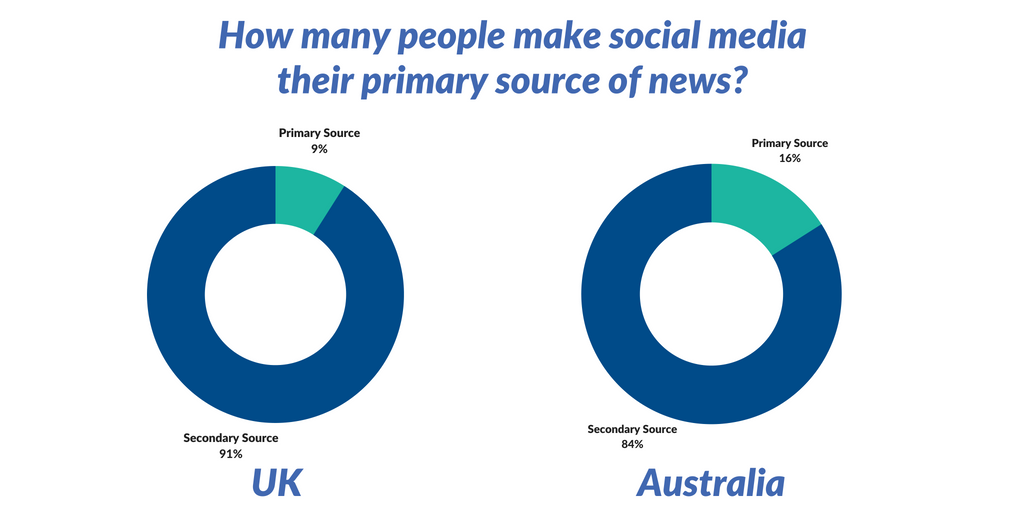
• 9% of us have made social media our primary location to find the latest news compared to 16% in Australia.
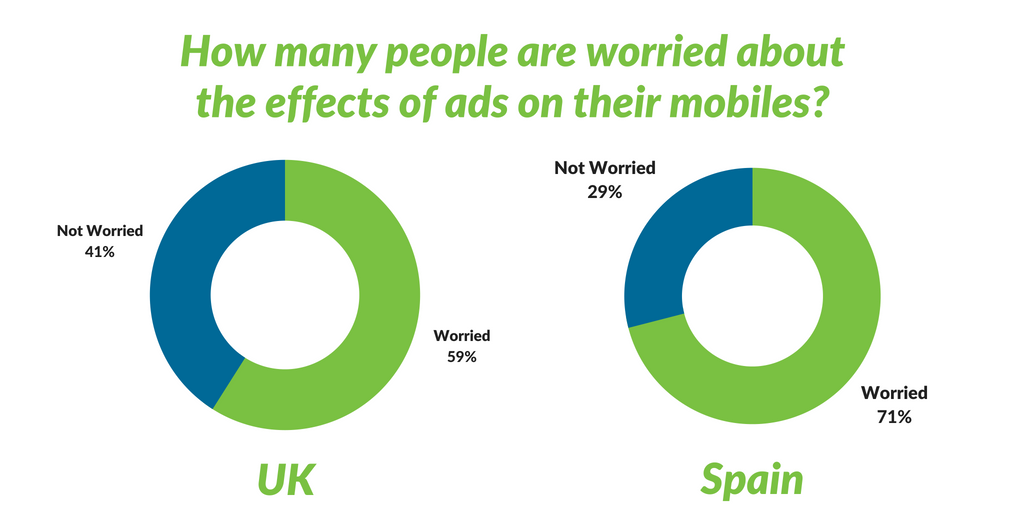
• Only 59% of us are worried about the affect mobile ads have on our phones compared to the 71% in Spain.
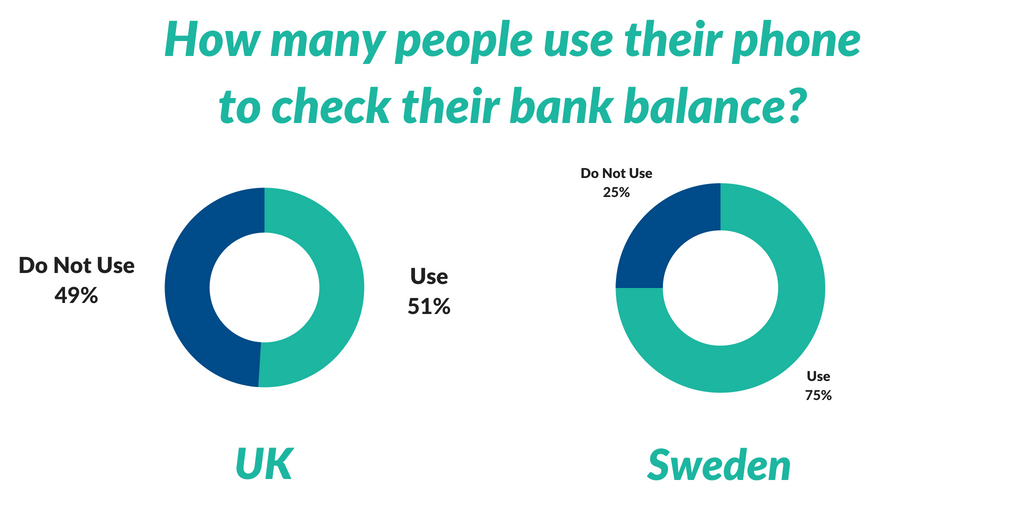
• Surprisingly, only 51% of us compared to the 75% in Sweden use our phones to check our balance.
So it’s clear to see how the communications landscape has changed in the 6 year period of 2011 – 2016. A lot can happen in just 6 years. We’re excited to see what the next 6 years brings… 5G and Gigabit Internet are already making waves, but what next?!